


Slowest decade of population growth in Singapore since independence: Census 2020

File photo of pedestrians wearing protective face masks along Orchard Rd in Singapore on Sep 9, 2020. (Photo: Gaya Chandramohan)


SINGAPORE: Singapore’s total population saw its lowest decade of growth since independence between 2010 and 2020, increasing by 1.1 per cent a year - a slowdown from the 2.5 per cent per year between 2000 and 2010.
This was among the findings released on Wednesday (Jun 16) by the Department of Statistics (DOS) in its first statistical release from its census of the population in 2020. More information from the census will be released on Friday.
The census – Singapore’s largest national statistical exercise – is conducted once a decade to collect demographic, social and economic data, among others. It surveyed 150,000 households last year.
READ: English gaining ground as the language most used at home: Census 2020
“It tells us where we were, where we're at now, and identifies some of the things that we need to address going forward,” said Indranee Rajah, Minister in the Prime Minister’s Office, who oversees the National Population and Talent Division.
Though some of the data will be affected as the survey was done amid the COVID-19 pandemic, she said the census captures “broad trends over the decade … notwithstanding the blips over the last one and a half years”.
The total population increased from 5.08 million in 2010 to 5.69 million in 2020. Within this, the citizen population grew from 3.23 million to 3.52 million, while the permanent resident population remained “stable” at around 0.5 million, it added.
The number of non-residents increased from 1.31 million to 1.64 million.
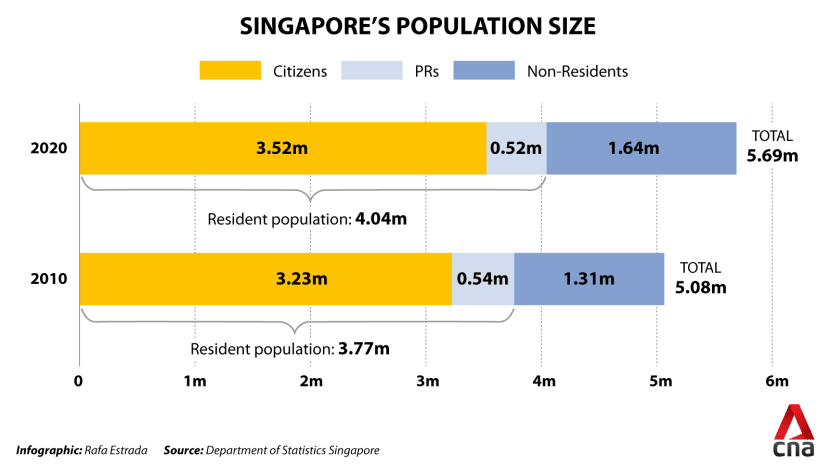
Ms Indranee pointed out that Singapore citizens accounted for a greater proportion of the growth this decade, while non-residents grew at a slower rate than before.
The DOS also said ethnic compositions for citizen and resident populations remained stable.
At the same time, the country’s population continued to age. In 2020, 15.2 per cent of the resident population was aged 65 and above, up from 9 per cent in 2010.
The median age of the resident population also rose to 41.5 years in 2020, up from 37.4 years in 2010.
READ: 20% of Singapore residents have no religion, an increase from the last population census
READ: More overseas citizens returning, fewer marriages: 5 things from Singapore's 2020 population report
RISE IN SINGLEHOOD
The census showed that singlehood has become more prevalent across multiple age groups over the last decade – particularly among younger residents aged 25 to 34.
The proportion of singles rose among all age groups that fell within the bracket of 20 to 49 years old.
The largest increase in the proportion of single people was seen among those aged 25 to 29. The proportion of single women in this group rose from 54 per cent in 2010 to 69 per cent, while single men grew from 74.6 per cent to 81.6 per cent in this age group.
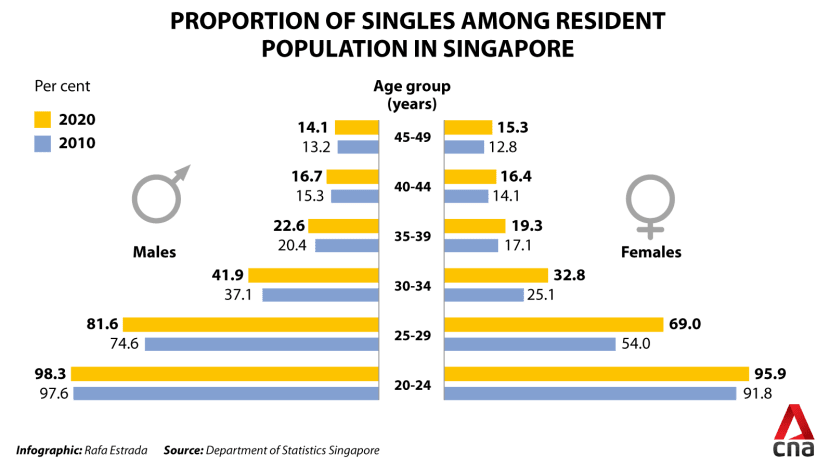
Not far behind were those aged 30 to 34: The proportion of single women in this bracket went up from 25.1 per cent to 32.8 per cent, while that of men increased from 37.1 per cent to 41.9 per cent.
When sorted by ethnic group, data showed that the Chinese had the highest proportion of singles.
For instance, in 2020, among residents aged 40 to 49, about 17.4 per cent and 18.6 per cent of Chinese men and women were single.
This was higher than 15 per cent and 9.2 per cent for Malay men and women respectively, and 6.2 and 6.3 per cent for Indian men and women.
FEWER CHILDREN BORN
At the same time, women generally had fewer children in 2020 compared to a decade before, said the DOS.
Among female residents aged 15 and above who have ever been married, the average number of children born fell across all age brackets. The average decreased from 2.24 children per woman in 2010, to 2.04 in 2020.
Lower averages were also seen across all educational groups, said the DOS, adding that the largest decrease was observed among women with below secondary qualifications.
READ: 1 in 4 Singaporeans marrying non-residents, increasing proportion involves non-resident men
In 2010, women in this group aged 40 to 49 had an average of 2.21 children, but in 2020, this figure fell to 2.01.
Still, in line with previous trends, higher educated females had fewer children on average than those with lower educational qualifications.
Among these female residents aged 40 to 49, university graduates had an average of 1.66 children in 2020 – lower than the average of 1.94 children among those with secondary qualifications, the DOS said.
EDUCATION LEVELS IMPROVE
The educational profile of the resident population improved between 2010 and 2020.
In 2020, among residents aged 25 and above, nearly six in ten had post-secondary or higher qualifications. This is up from less than five in 10 in 2010.
“The Chinese, Malay and Indian communities all saw improvements in their educational attainment,” added the DOS.
It also noted that women have “made more significant progress” in this aspect.
For instance, among residents aged 55 and over in 2020, the proportion of men with post-secondary or higher qualifications was 11.2 percentage points higher than that of women.
This narrowed to a 2.4 percentage-point difference among those aged 35 to 44.
Among those aged 25 to 34, the proportion for women – at 90.2 per cent - marginally beat the figure for men, which was 90 per cent.
Overall, literacy rates rose to 97.1 per cent in 2020, up from 95.9 per cent in 2010.
Across all age groups, multi-language literacy rates were also higher or remained stable.
There was an overall increase in English literacy across the three major ethnic groups, the DOS noted.
RELEVANCE OF SORTING DATA BY ETHNIC GROUPS
At a press conference on the release of the data, Ms Indranee was asked by reporters about the continued relevance of separating data by ethnic categories, given that there may be sharp inequalities even within these groups.
Ms Indranee said being a multi-racial and multi-religious state is “a constant work in progress”.
“(This) also means that you don't really ever get to a post-race situation where it doesn't matter at all.”
She added: “If you didn't have this data - then let's say that a particular ethnic group was not doing well compared to the others. You will have no idea how many, you will have no idea in what areas, you wouldn't know whether the problem was education, or whether the problem was something else.
READ: New workgroup set up to improve health of minority ethnic groups
“All you would have is just one big blob of data, and you will have no ability to say, actually this group is not doing so well. What are the reasons, how can we help, what are the interventions that we can make?”
“The thinking behind this data is: To the extent that any group may not be doing as well as any others in any areas, then it tells us that as a society in terms of policy, then we should do something to try and make sure that we can bridge any gap.”

