Five concepts from the study of diseases you should know in the fight against Covid-19

Armed with better understanding of information shared, the public will be more prepared for the Covid-19 outbreak until effective vaccines and treatments become widely available.
Certain mathematical models for simulating financial markets are similar to those for studying epidemics.
We know this because we are two financial modellers who have been involved in modelling epidemics for public health authorities.
Here, we would like to do our bit for public education on the Covid-19 outbreak by explaining five concepts from epidemiology, which is the study of how often diseases occur in different groups of people and why.
The hope is that when the public is better able to understand what information about Covid-19 is shared, it will minimise irrational fear.
KEY STATISTICS
The media has been reporting on the number of newly infected and deaths cases daily. What is equally important is the number of recoveries, which is infrequently reported by the media.
Imagine this: There are 10 newly infected and three deaths one day. This sounds terrible, but if eight people recover on that day, then there is a net “exit” of one patient (3+8-10) from the pool.
In any epidemic, perhaps the most important indicator is whether the net pool is increasing or decreasing.
Another helpful statistic is the growth factor, which is each day's new cases divided by new cases from the previous day.
The growth factor computed from total cases reported (worldwide) was mostly below one from Feb 13 to 19, but surged back to mostly above one from Feb 20 until now, as infections began spreading rapidly beyond China to other countries.
Sophisticated models should also consider relevant country-level statistics, such as population, density, travel frequencies, medical resources available per capita and spare capacities in health systems to cope with infectious diseases.
EPIDEMIC PYRAMID
The typical classifications in an epidemic pyramid are death, severe, mild and asymptomatic, as follows:
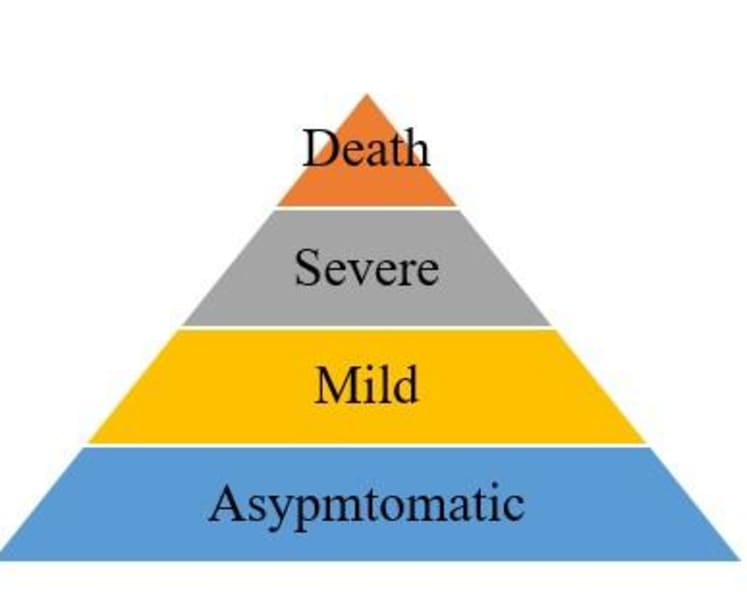
Learning from their Sars outbreak experience in 2003, Singapore and Taiwan have resources and operating procedures in place to reach deep down the pyramid to trace every (asymptomatic) case possible even before symptoms are shown.
But let’s be realistic. No matter how effective the screening process is, there will be misdiagnosis.
Initial statistics collected from any outbreak almost always understate the full burden.
For example, the United States Centers for Disease Control and Prevention initially estimated 12,469 deaths for the H1N1 virus in the US from April 12, 2009 to April 10, 2010. But by 2019, it increased its estimate for that period to at least 75,000 deaths, or six times the earlier figure.
Initial observed fatality statistics can be used to project the full burden with data that may take months or even years to arrive. This is called a cross-sectional problem because we take one cross section of the pyramid to make an educated guess on the size of a deeper cross section of the pyramid.
Case fatality rate is the number of deaths over a defined period of time divided by the number of individuals diagnosed with the disease during that time.
This is a different problem by focusing on the time dimension. As long as epidemic models are careful in drawing conclusions from data already available at specific time points, they can still provide helpful insights.
TOCC (TRAVEL, OCCUPATION, CONTACT, CLUSTER) TRACING
Some countries may be too big in physical size. Many lack the resources to test and diagnose every suspected case.
Moreover, many patients avoid seeking medical help until they show severe symptoms. As a result, we have to assume that a portion of undiagnosed patients may still be infecting others in the overall population.
As long as there is a way to perform TOCC tracing from the diagnosed cases, there is a path to slow down the spread of infections.
Public health officials worry the most about infections from unknown sources — also known as the silent patients — in which contacts cannot be back-traced easily.
When the silent patients include say a taxi driver, he or she may have infected some passengers with no easy way to trace all related passengers riding his/her taxi.
That is how epidemic control can become extremely challenging.
Those were the worrying signs observed in the early stages in Wuhan and Hubei, and perhaps we are noticing similar patterns emerging in Japan, South Korea, Iran and Italy.
TREATMENTS
From an epidemiological point of view, patients are removed from the pool by either recoveries or deaths.
The human body does have natural mechanisms to rid itself of viruses including the Covid-19 virus, but that is not always successful before the onset of other fatal complications.
Therefore, the medical goal is to increase recoveries by treatments and to decrease deaths.
Certain treatments such as antibody therapy have been around since the 1970s. The issues are what dosage to use for which types of patients, and whether there are any potential side effects.
Safe vaccines may take many months to develop by clinical trials.
In a public health emergency such as the outbreak in Wuhan, public health authorities may choose to bypass lengthy clinical trial procedures, but it is unwise if shortcuts are taken everywhere.
EPIDEMIC MODELS
Epidemiologists describe the dynamics of how a disease is spread with mathematical models to better predict the effectiveness of disease control measures using “before and after” analyses.
Impactful epidemic models require: 1) reasonable and transparent data as model parameters, or the entire exercise will become “garbage in, garbage out”; 2) a research environment where model results can be discussed openly to focus time and energy on the roughly correct models.
There is a legitimate policy concern that raw data may be prone to misinterpretations by potentially faulty analyses, creating unnecessary fear among the public.
Discussions among responsible scientists can take place in a “moderated” but still expedited forum (such as on the medRxiv server co-hosted by Yale) to encourage participation and to minimise unnecessary overreactions to preliminary results.
This way, “scientifically credible” clinical data can be released in a much shorter timeframe than the typical journal peer review process to allow other scientists to begin accessing the data, creating a win-win solution to address both scientific and public policy concerns.
We encourage everyone with a good grasp of these concepts to review the primary sources instead of relying solely on secondary sources to interpret the statistics.
For example, a recent report by the World Health Organization Collaborating Centre and the MRC Centre for Global Infectious Disease Analysis at Imperial College London shows the estimates of the overall case fatality ratio in all infections (asymptomatic or symptomatic) of Covid-19 to be approximately 1 per cent.
The confidence range is from 0.5 per cent to 4 per cent. At the low end of the range or 0.5 per cent, Covid-19 is a low fatality but highly infectious disease like a terrible influenza, but public health officials may need to consider additional measures at the high end of the range or 4 per cent.
Armed with better understanding of information shared, the public will be more prepared until effective vaccines and treatments become widely available.
ABOUT THE AUTHORS:
Anthony G Constantinides is Professor of Communications and Signal Processing of the Department of Electrical and Electronic Engineering and heads the Financial Signal Processing Lab at Imperial College London. Imperial alumnus Dr Bernard Lee is Founder and CEO of financial analytics firm HedgeSPA and author of Investment Analytics in the Dawn of Artificial Intelligence.