Why the percentage of pupils going from primary to secondary school has remained the same over 5 years

Students at Northoaks Primary School collect their PSLE results on Nov 25, 2020. (Photo: Facebook/Lee Hsien Loong)
SINGAPORE: PSLE scores of primary school students are not “force fitted” into a bell curve by the Ministry of Education (MOE), a spokesperson said on Monday (Dec 7).
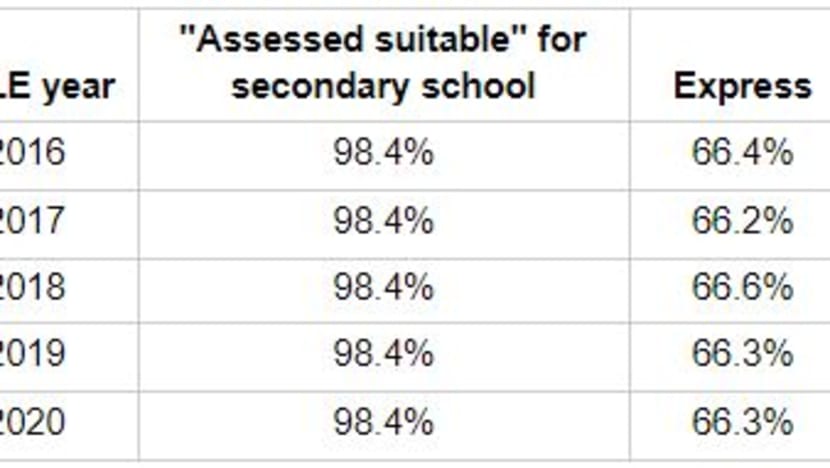
The percentage of students “assessed suitable to progress” from primary to secondary school has remained the same over the past five years - 2016 to 2020 - at 98.4 per cent.
READ: PSLE results: 98.4% of students can progress to secondary school
The percentage of those going into the Express stream in this same period has stayed between 66.2 per cent and 66.6 per cent, while those going to Normal (Academic) has remained between 20.6 per cent and 21.4 per cent.
About 10.6 per cent to 11.2 per cent of pupils went to the Normal (Technical) stream.
The number of students who have taken the PSLE over the last five years was between 38,800 and 40,300.

NO BELL CURVE GRADING: MOE
In response to CNA’s queries on the consistent results in recent years, the MOE spokesperson said bell curve grading is not used in any of the national exams.
“In the current PSLE T-score system, the T-score uses a statistical method to represent how well a student has done in relation to his/her peers. T-scores are not forced into a bell curve,” said the spokesperson.
According to the Singapore Examinations and Assessment Board's (SEAB) website, the aggregate T-score indicates how well a student has performed on average in all four subjects relative to his or her cohort. It is used to determine the priority of admission to secondary schools and the eligibility for the different secondary school pathways.
From next year, PSLE scores will be calculated using achievement level bands and students will receive 1 to 8 for each of their four subjects, with their final score made up of the sum of these achievement levels.
READ: New PSLE scoring system: MOE releases range of indicative cut-off points for different types of secondary schools
The A, O, N(A) and N(T) Level exams are standards-referenced, where the grades awarded reflect a candidate’s “own level of mastery in the subject” based on an absolute set of standards, said the spokesperson, adding that this is regardless of how well students have performed in comparison with their peers.
The new achievement level bands system for PSLE will also be standards-referenced.
“Statistically, test scores of a large population of candidates would tend to fall into a normal distribution or bell curve,” the spokesperson added.
“This is unsurprising as there will be natural variation in the level of mastery in any subject among a large group of students.
“However, this does not mean that we had force fitted the exam scores of students into a bell curve.”
The papers are set with a “balanced proportion” of basic, average and challenging questions, and this proportion remains the same every year so as to “maintain the overall standard of exams”, the spokesperson explained.
But the distribution of grades is not “predetermined” by a bell curve.
“If there are more candidates demonstrating better quality work, a higher percentage of them will be awarded better grades.”
READ: Commentary: Kids taking PSLE next year may have a very different experience
BALANCE OF QUESTIONS
The SEAB has processes in place to ensure that the overall standards of national examination papers are maintained across the years, said the spokesperson.
This responsibility falls on a panel of experienced school teachers, MOE curriculum specialists and SEAB assessment specialists.
The MOE spokesperson said the panel “adheres to a test blueprint” to ensure that the examinations are aligned to the syllabus objectives and that “learning outcomes and standards are maintained from year to year”.
There is also an “appropriate balance” of easy, average and more challenging questions in the exam papers, the spokesperson said.
LISTEN: PSLE results: Three working adults confront its impact and other surprising revelations years later
“To maintain comparable standards every year and ensure that all candidates receive a fair and valid assessment, grading takes into consideration ... factors such as the overall difficulty of the paper and the overall quality of candidates’ work for that examination year.
“The percentages of students progressing to each course in secondary school are based on actual cohort performance.”


